GL
GL
 SA
SA EG
EG UAE
UAE ZA
ZA

Measuring your warehouse efficiency and productivity is crucial to achieving your business goals. Here’s how you can make sure you’re measuring the metrics that matter.
Measuring the productivity of your warehouse on an ongoing basis helps you keep your finger on the pulse of your operations. Warehouse productivity is defined by a series of measurements which keep track of performance such as how long it takes to complete specific tasks, cost per unit, throughput and so on.
One of the best ways to ensure that your warehouse operations are running smoothly, is to benchmark your warehouse against your peers and industry leaders.

Below are some of the key metrics you should be measuring in your warehouse.
You can use this list to identify the typical key metrics measured in warehouse operations, so that you can optimise your processes and achieve your business goals.
Inventory management metrics
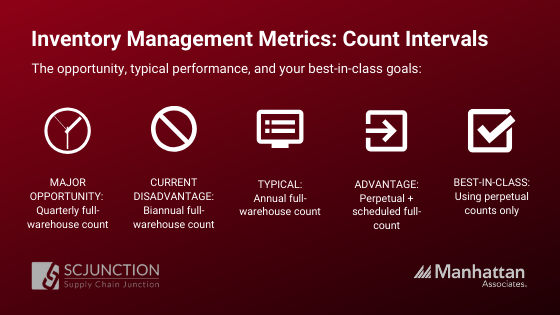
Inventory count intervals
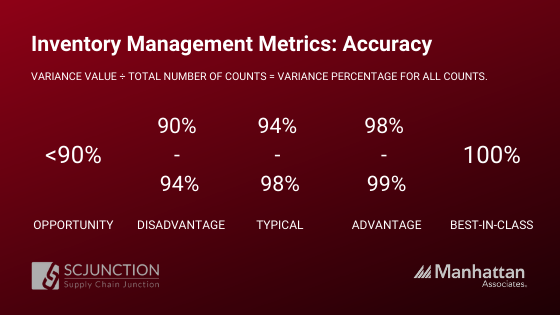
Inventory accuracy
Variance value is determined by whether there’s a difference between system quantity (expected stock on-hand) and quantity counted (actual stock on-hand).
This variance value is divided by the total number of counts to obtain the variance percentage, for all counts.
The variance percentage is subtracted from 100%.
Absolute total unit count accuracy
Unit count accuracy variance value is determined through the absolute value of system quantity divided by quantity counted. This variance value is divided by system quantity to obtain the variance percentage for total units.
The variance percentage is subtracted from 100%.

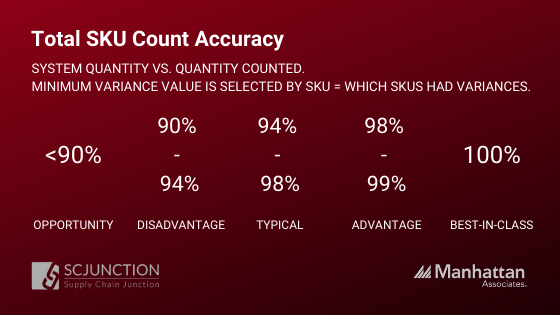
Total SKU count accuracy
Variance value is determined when there’s a difference between system quantity and quantity counted. The minimum variance value is selected by SKU to determine which SKUs had variances.
The variance percentage is subtracted from 100%.
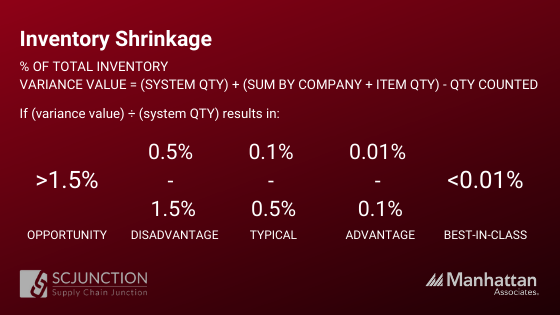
Inventory shrinkage percentage of total inventory
Variance value is determined by subtracting quantity counted from system quantity, aggregate (sum) by company and item, to determine which SKUs shrunk in quantity.
If the SKU didn’t shrink in quantity, then the variance is set to zero.
The remaining variance value is divided by the total system quantity.
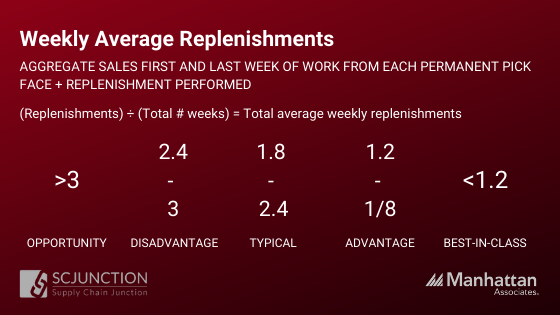
Average replenishments per active permanent pick face per week
Calculate the first and last week where there was work from each permanent pick face in aggregate sales.
The data is joined to the replenishments performed to quantify replenishments that happened within the defined date range. The replenishments are counted and divided by the number of weeks, per permanent location, to determine the average number of replenishments per week.
The total is an average of the number of replenishments per location per week.
Inbound metrics
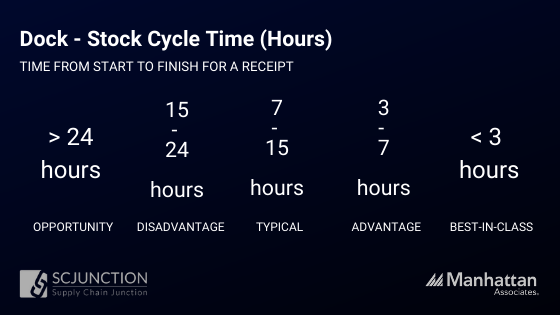
Dock to stock cycle time in hours
Calculate the time from start to finish for a receipt. The start time is set as the appointment time if it’s been filled in, otherwise the receipt start time is used.
Finish time uses the receipt close time. Dock to stock is then the number of minutes between the start time and finish time by receipt and then averaged for all receipts.
Minutes are converted to a decimal number of hours.
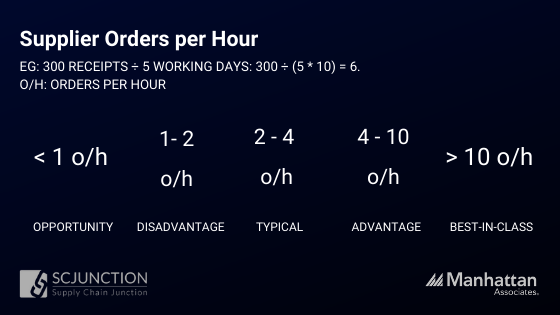
Number of supplier orders received per hour
Calculates the number of working days within the provided data range and then uses a standard ten hour working day.
The number of receipts within the date range is then divided by the number of total hours for that range – for example, 300 receipts over five working days would equate to: 300 / (5 * 10) = 6.
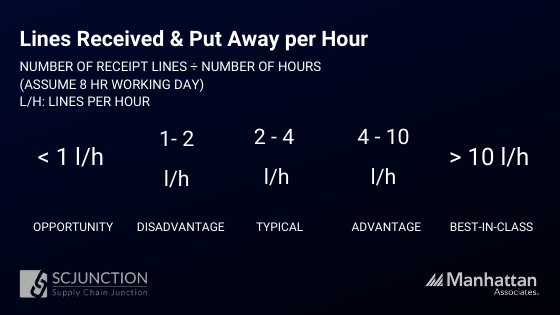
Lines received and put away per hour
Within the requested date range, the number of receipt lines is divided by the number of hours (assuming an eight hour working day).
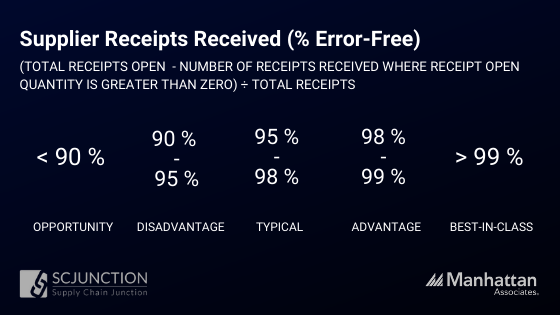
Supplier receipts received error free percentage
The percentage of supplier receipts received with errors is calculated as the number of receipts received where receipt open quantity is greater than zero.
This is then subtracted from the total number of receipts for the period and then divided by the total to obtain a percentage value.
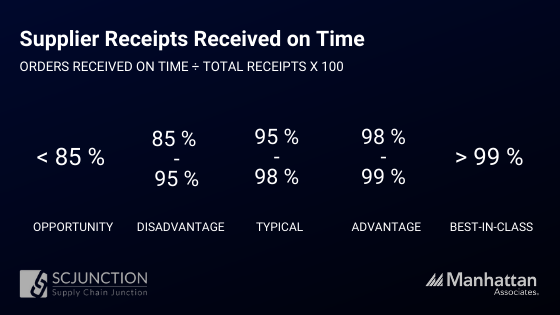
On-time receipts from suppliers
The percent of orders received from a supplier per on time requirements.
Outbound metrics
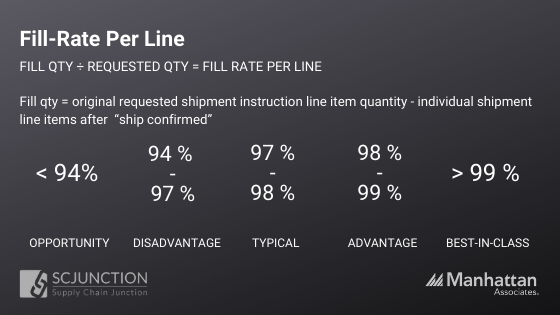
Fill rate per line
The fill quantity is calculated by analysing all individual shipment line items after the completion of “ship confirmed” (closed), compared to the original requested shipment instruction line item quantity.
The difference is then divided by the requested quantity and aggregated for all orders within the defined benchmarking period.
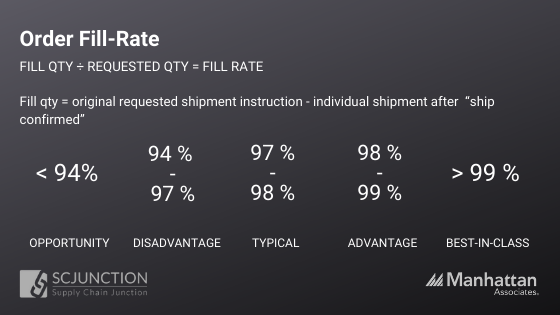
Order fill rate
The order fill quantity is calculated by analysing all shipment instructions after the completion of “ship confirmed” (closed), compared to the original requested shipment instruction total item quantity.
The difference is then divided by the shipment requested quantity and aggregated for all orders within the defined benchmarking period.
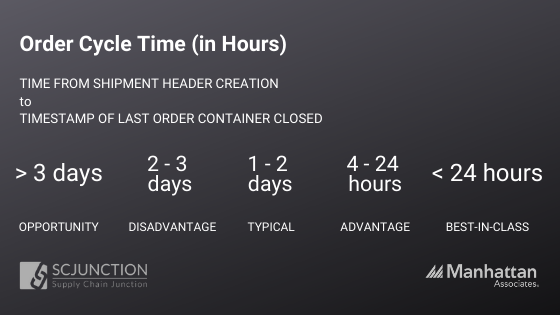
Order cycle time in hours
The time elapsed from the shipment header creation until the timestamp of when the last container for an order is closed. The calculation assumes a working day is eight hours. The average order cycle time is calculated for all shipments.
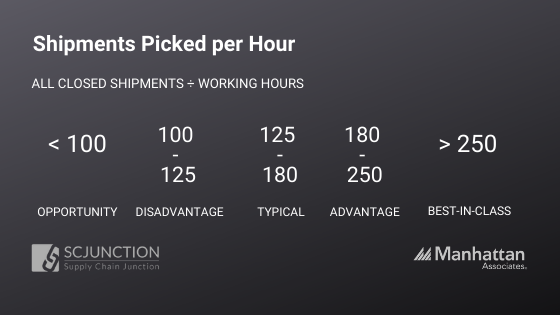
Shipments picked per hour
Using all closed (completed) shipments divided by the number of working hours within the defined date range (assuming an eight hour working day).
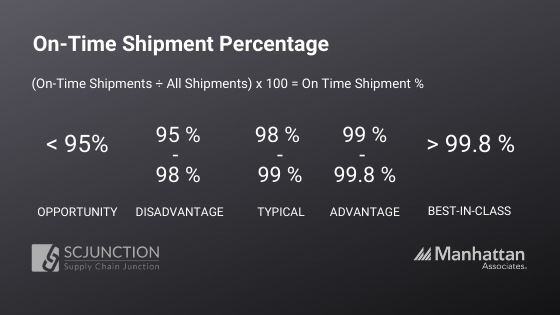
On-time shipment percentage
Financial and quality metrics
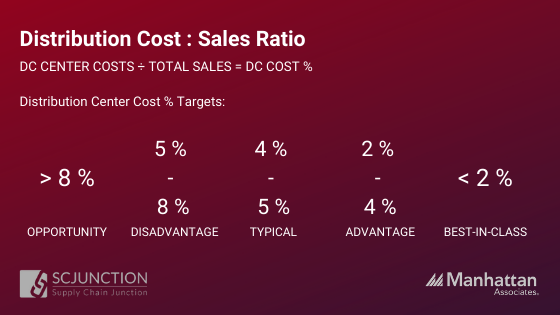
Distribution costs as a percentage of sales
The cost to run distribution relative to total sales.
Activities included in the operate warehousing process are:
- management activities;
- track inventory deployment;
- receive, inspect, and store inbound deliveries;
- track product availability;
- pick, pack, and ship product for delivery;
- track inventory accuracy;
- track third-party logistics storage & shipping performance.
This metric is calculated as Total distribution costs/ Total sales
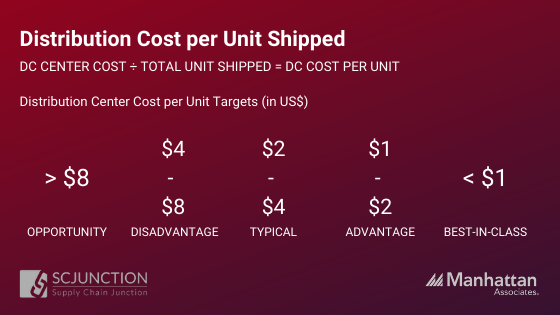
Distribution cost per unit shipped
The cost to run distribution relative to the units shipped through distribution
This metric is calculated as Total distribution costs/ Total units shipped (e.g. cases)
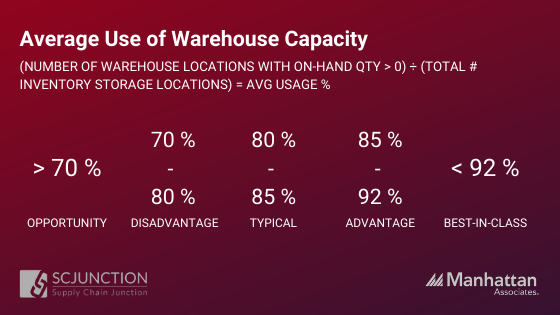
Average warehouse capacity used
The number of inventory storage locations with an on-hand quantity greater than zero, is divided by the total number of inventory storage locations, for all inventory locations.
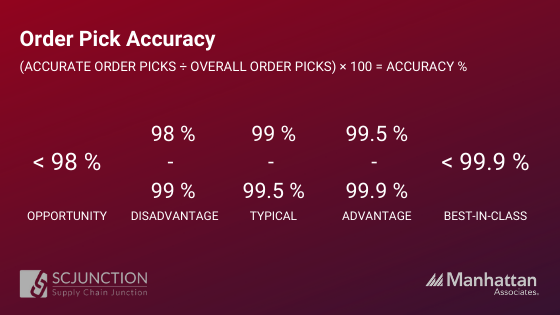
Order pick accuracy
Theorder pick accuracy is calculated by determining the number of orders that were picked in full versus the orders that were short picked or short packed.
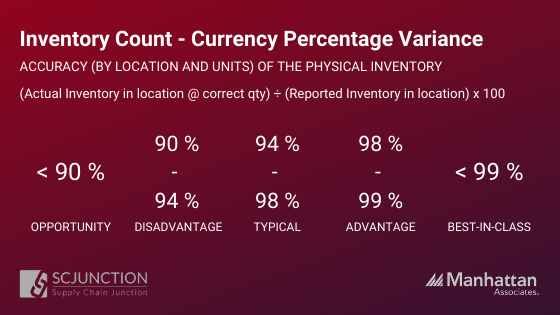
Inventory count - currency percentage variance
Measures the accuracy (by location and units) of the physical inventory compared to the reported inventory: If the warehouse management system indicates that 10 units of part number XYZ are in slot B0029, the inventory count accuracy indicates how frequently one can go to that location and find that the physical count matches the system’s.
This calculated using the sum of the absolute variance in units or dollars / the sum of the total inventory in units or dollars.
A warehouse management system(WMS) helps streamline your warehouse operations, by giving you real-time access to accurate data. The right WMS should identify weak points in your processes, collect the necessary data and enable you to optimise your operations and make ongoing improvements.

Share